Data Charts PowerPoint Template PowerPoint
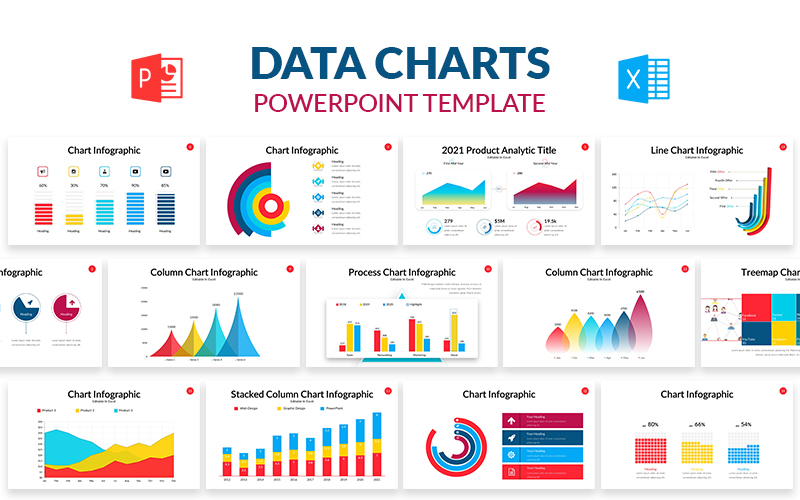


Great and amazing way to graphically communicate your information clearly with engaging impact. The template provides creative and modern data charts for your brands. This template is ideal for any kind of Business plan, Marketing plan, Monthly or Yearly analysis, Presentation ideas and any other purpose that requires creative data charts.
There are many color options to choose from, with Light and Dark version. It comes with 2 Aspect ratios and Vector Icon Library. The slide contents are based on Master slide and are fully editable.
Product Features
- 50 unique slides
- PPT and PPTX files
- High-res 1920×1080 Pixel (Full HD)
- 2 Aspect Ratio (4:3 & 16:9)
- 12 Color Schemes
- Light and Dark Version
- Fully and easily Editable contents
- Design based on Master Slide layout
- All objects are vector shapes
- 3000+ Vector Icon Library
- Free font used
- Drag and Drop ready
- Free update and Support.
Included Files
- PPT and PPTX files
- XML Files (24 Ms Office Theme Colors & 1 Ms Office Font Type)
- Documentation file
- Vector Icon Library
Font Used
Lato Font
The images used are illustrative purpose only. They are not contained in the template.
Great Support
Please read the documentation before opening the presentation. If you have any question, feel free to contact us. We will be delighted to help.
-
Free 24/7
Support Team -
Ready Solution
For Business -
Premium
Quality -
1 200 000+
Satisfied
Customers
| Template # | 176838 |
| Type: | PowerPoint Templates |
| Downloads: | 5 |
| Sources available: | |
| Software required: | |
| Keywords: | multipurpose creative editable marketing line templates presentation powerpoint diagram pitch deck data finance bar excel chart infographics statistics pie column charts graphs |
| Template # | 176838 |
| Downloads: | 5 |
| Sources available: | |
| Software required: | |
| Keywords: | multipurpose creative editable marketing line templates presentation powerpoint diagram pitch deck data finance bar excel chart infographics statistics pie column charts graphs |